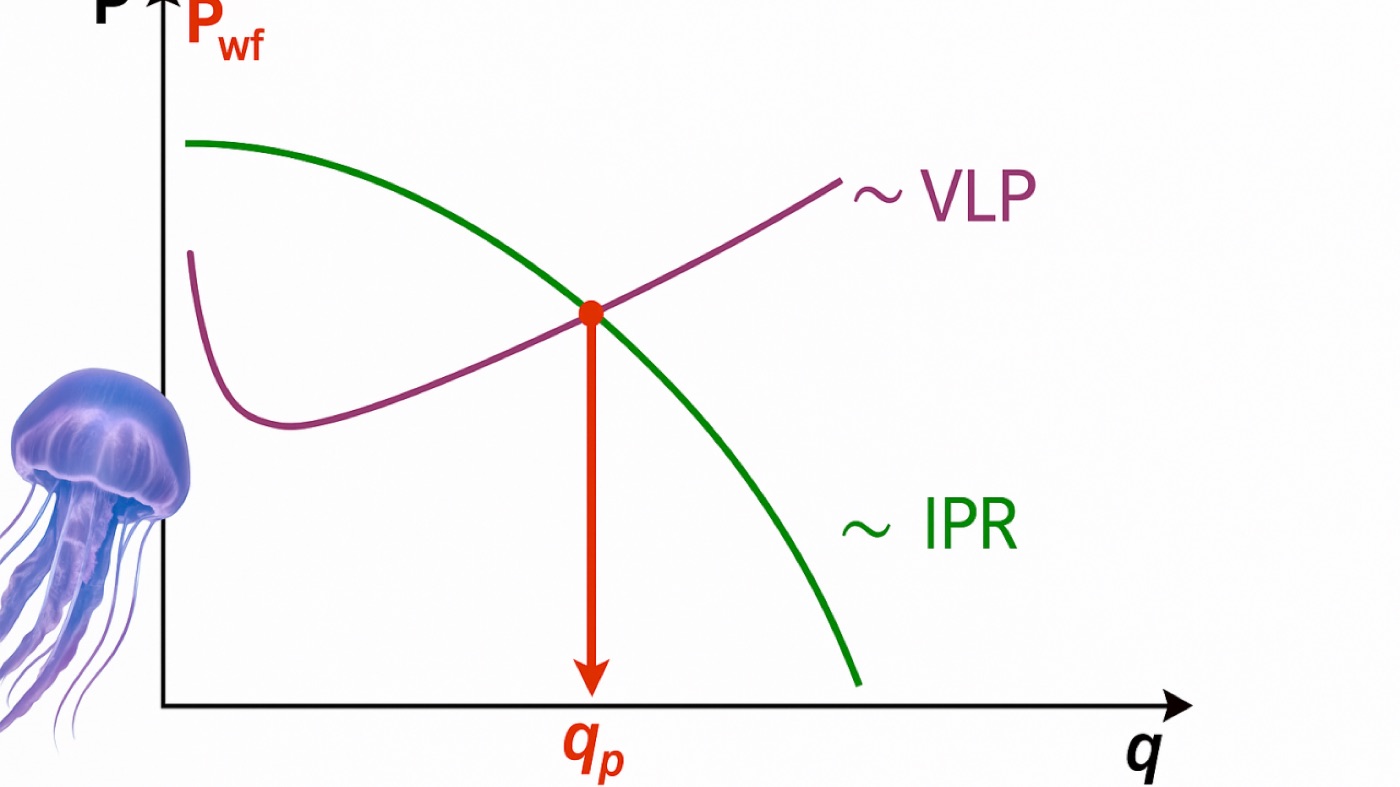
Generations of petroleum engineering graduates were taught the mysterious “left-hand tail” of Vertical Lift Performance (VLP) curves, where (quite bafflingly) reducing bottomhole pressure (BHP) paradoxically corresponds to higher production rates? This phenomenon, often labelled as an “unstable solution,” has traditionally been swept under the rug, leaving engineers quietly agreeing to pretend it doesn’t exist. But does this tail actually reflect some subtle physical reality, or are we simply victims of a mathematical prank?
To briefly recap, a VLP curve depicts the relationship between bottomhole pressure (BHP) and production rate, accounting mainly for two types of pressure losses:
- Gravitation loss: depends on fluid mixture density and depth
- Friction loss: monodically increases with fluid velocity
- (We politely ignore acceleration losses for simplicity, because, frankly, life’s complicated enough already.)
Let’s dive into the paradoxical nature of this left-hand tail.
The Paradox of the Left-Hand Tail
It’s critical to emphasise that in NODAL analysis, VLP and IPR curves are constructed independently. This isolation allows us to scrutinise the VLP curve alone, without interference from reservoir dynamics
My angle of attack on this phenomenon:
- Dual Solutions at a Given BHP: The left-hand tail implies that the same FBHP corresponds to two different flow rates of the same system. What variable would determine which rate the well would flow at? This duality introduces ambiguity that isn’t physically intuitive (don’t get into the details yet, just an observation)
- Negative Slope: The left-hand tail shows a negative slope, meaning that as the flow rate decreases, BHP paradoxically increases. Since friction losses increase monotonically with flow velocity, they can’t be blamed for this oddity. This negative slope must come from changes in fluid density as BHP reduces, implying incompressible fluids like water or undersaturated oils shouldn’t produce such tails. Gas and volatile oils might be the prime suspects here.
- Dual Density States: Building on this density mystery, we encounter another paradox. Can the same fluid system, at identical pressure conditions, somehow exist in two distinct density states simultaneously, one would promote higher flow and one would promote lower flow when FBHP increases? Whether you use sophisticated EOS or simpler black oil models, physics stubbornly says, “Absolutely not!”
- Minimum BHP of VLP curve: The curve’s minimum represents the lowest BHP capable of sustaining a steady-state flow, overcoming gravitational and frictional losses, and tubing head pressure. Could a well flow steadily below this rate? If so, at what BHP? It’s tempting to consider the left-hand tail as a brief, chaotic transition during startup before the system settles down, but our steady-state models politely excuse themselves from capturing such dynamic drama.
My Personal Take
Friction loss in laminar flow scales linearly with velocity, and in turbulent flow scales to the power of about 1.7 to 2 (quadratic). Given this non-linear relationship and iterative numerical solving, the left-hand tail might be nothing more than a mathematical quirk—akin to the square root of 4 yielding both 2 and -2, even though -2 makes about as much physical sense as a negative barrel of oil. (I’m still chasing a mathematical proof, but so far, it’s rather elusive)
From a practical standpoint, engineers have wisely ignored the left-hand tail for generations, perhaps intuitively recognising when mathematics and physics had a brief falling-out. But if you’re ever tempted to trust this “unstable” tail, at least you now know enough to question it, and maybe have a laugh as you cautiously step around this modelling mystery.
#VLP #WellModelling #SteadyState #Paradox #PetroleumEngineer #NodalAnalysis #CriticalThinking #EngineeringCuriosity