
I hope Part 1 got you thinking—and more importantly, kept you interested enough to come back for Part 2. Admittedly, I’ve taken a slightly unconventional route by starting with a use case before discussing fundamentals. Why? Because I wanted to first answer the “why”: why we need something better than averages, gut feel, and spreadsheetsto guide operational decisions. Now in Part 2, we take a step back to focus on the “how”—specifically, how to understand and improve your existing operations using a data-driven lens.
This post serves as a primer—not a deep technical dive—but enough to get hands-on with business process mining, and to see how this approach can transform the way we manage and optimise operations.
🧠 What Is a Business Process Anyway?
A business process is simply how things get done in an organisation. It includes the sequence of steps, people, systems, and decisions that transform inputs into outputs. These processes can be:
- Individual (performed by one person),
- Functional (within a single department), or
- Cross-functional (spanning multiple teams or systems).
👉 A workover process, like the one we discussed in Part 1, is a classic cross-functional process: production engineer team, scheduler, workover team, rig crews—all play a part.
🔎 Process Mining: Bridging the Gap Between What You Think Happens and What Actually Happens
*“Process mining reveals how your process is really being executed—using data, not assumptions.”.*Most organisations document the “official” process on a whiteboard or in a flowchart. But as anyone who’s worked in the field knows, the real process can be… messier.
Process mining uses event logs(depicted in below picture), digital traces of activity from systems like SAP. Each event typically includes:
- A case ID (e.g. failure ID),
- An activity name (e.g. “rig assigned”),
- A timestamp, and
- A resource (e.g. engineers or rig).
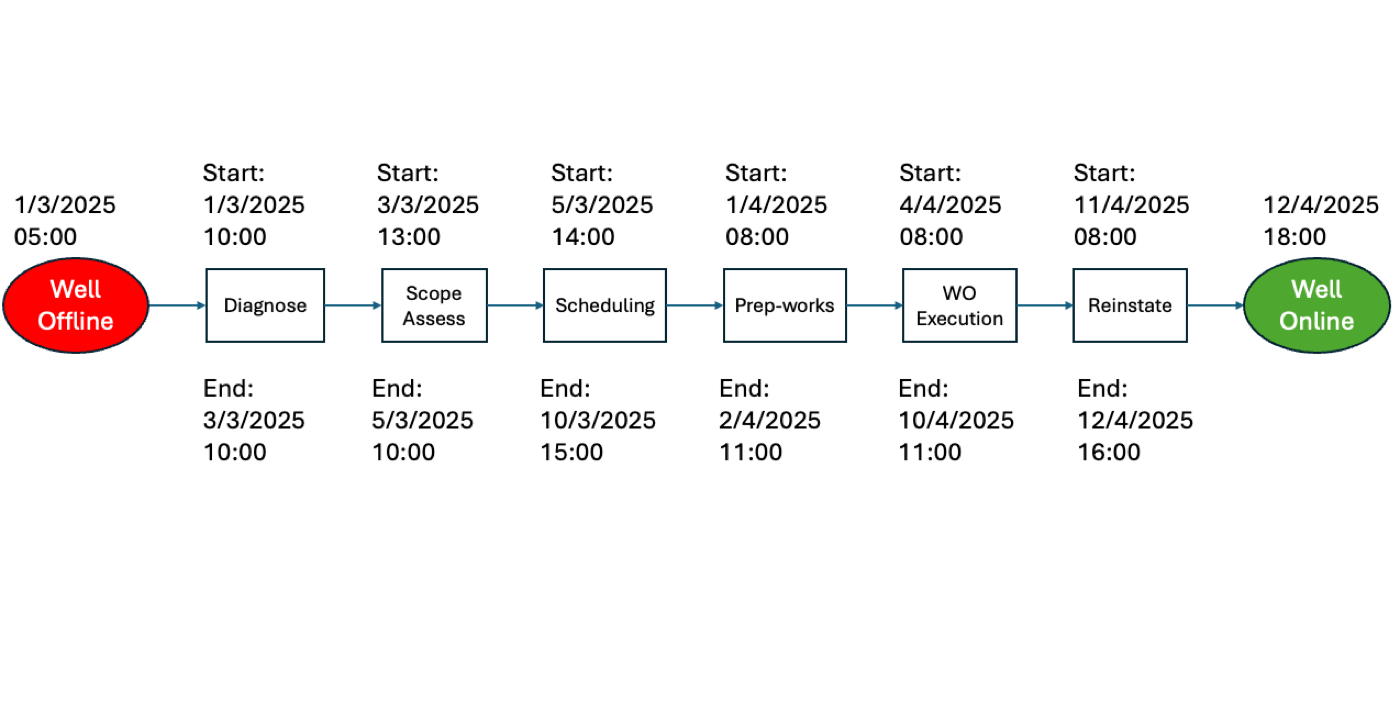
A Workover Process - A Cross-Functional Process
By analysing event logs, process mining enables you to:
- Visualise the actual paths your process takes (not just the ideal path),
- Spot inefficiencies, rework, and bottlenecks,
- Quantify metrics like MTTR, resource utilisation, and queue time by activity,
- Compare performance across teams or regions.
This isn’t just about drawing pretty diagrams—it’s about uncovering real, hard-to-see blockers in your system.
🧩 Key Components of a Process
To analyse or redesign a business process, start by defining:
- Inputs and Outputs: Clearly set the boundaries of your analysis. A production engineer might define a process from “failure occurrence” to “well reinstatement,” whereas a workover engineer might focus from “rig assignment” to “handover completion”. The definition depends on your study objectives.
- Flow Units: These are the entities moving through your process (e.g., failure events, workover requests, maintenance notifications).
- Activities and Buffers: Activities include any task or action (e.g., triage, scheduling, repairs), while buffers represent waiting periods or queues between these activities.
- Resources: The people, equipment, or systems performing activities (e.g. rigs, techs, schedulers).
- Information Structure: The data required to trigger, execute, or transition activities—think notifications, approvals, and criteria for prioritisation.
🧪 From Raw Data to Simulation Inputs
A significant advantage of using simulation models over traditional, mean-based approaches is their ability to incorporate real-world variability through random value/event generators. Here’s how to achieve this in practice:
- Visualise Your Data: Use histograms, box plots, or quantile plots to understand your data’s distribution.
- Choose a Distribution Family: Identify potential probability distributions (e.g., exponential, Weibull, lognormal) that closely represent your data.
- Estimate Parameters: Fit your chosen distribution to historical data using statistical methods or software tools (e.g., Python’s SciPy, R’s fitdistrplus).
- Build the Random Generator: Generate random events or values based on your fitted distributions, creating realistic simulation inputs.
By using accurate distributions, your simulation will reflect real operational variability, allowing you to test scenarios robustly and reliably.
🚀 Next Steps
This primer sets the foundation for using process mining and simulation to transform process improvement decision-making. Equipped with these tools, you can confidently identify bottlenecks, test improvements, and optimise resource use.
💡 Are you currently leveraging data-driven methods to manage your processes? 🔧 What surprises have you uncovered when comparing your intended processes to reality?