In Part 1 of this two-part series on Data-Driven Operations Process Improvement, we explore how simulation can offer rigorous, science-backed insights—far more reliable than aggregated averages or intuition-led planning.
🎯 The Use Case: Workover Operations
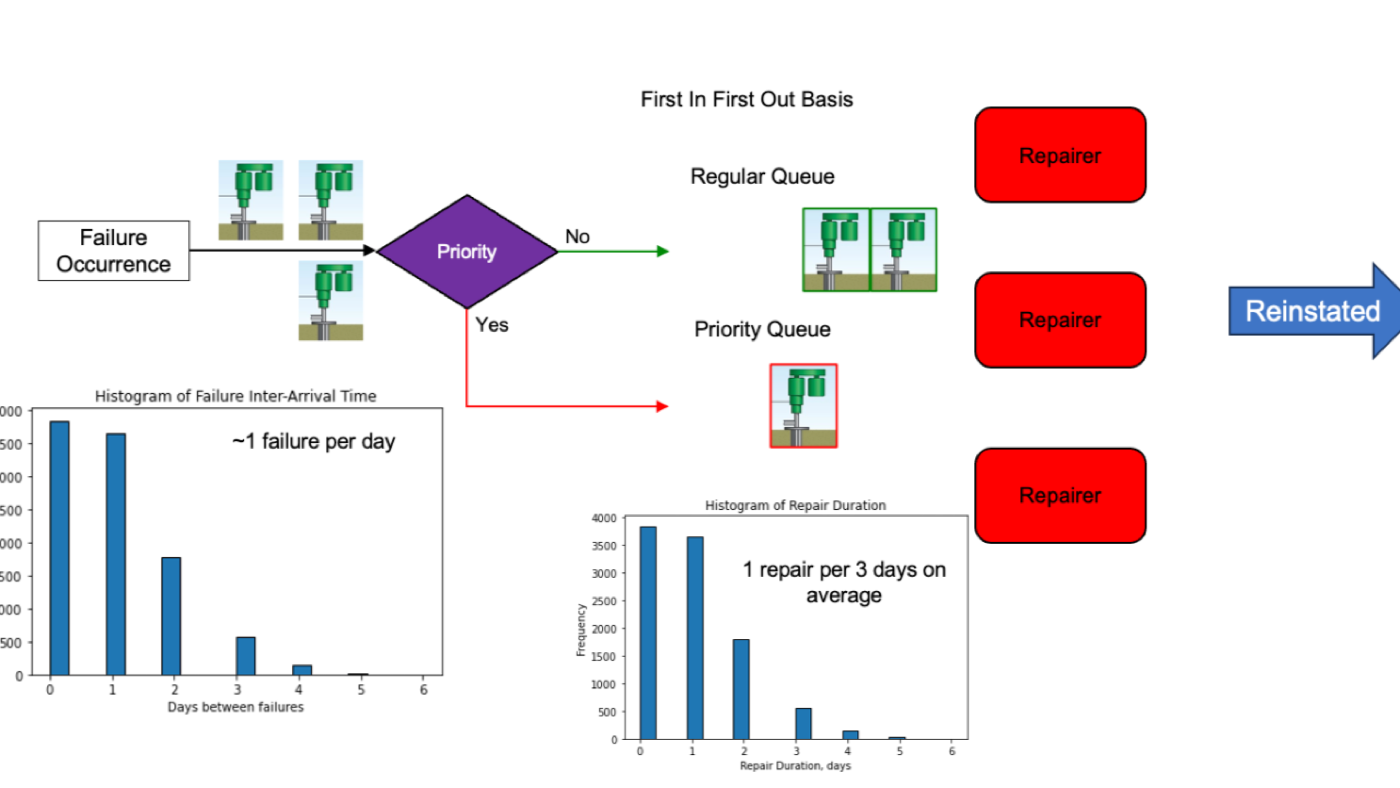
Let’s take a look at a simplified workover process. In practice, we know these systems are rarely straightforward, yet the framework can be surprisingly intuitive and a good start:
- A failure event occurs—this is driven by factors like MTTF (Mean Time to Failure) and the number of wells in your fleet. Modelled by Poisson process
- A triage step classifies the event as either priority or regular, based on your business rules (e.g., production value or strategic importance). ~10% is priority
- Events are placed into two separate queues.
- Three rigs (repairers) pick up events on a First In First Out (FIFO) basis within each queue, always prioritising priority jobs first. Workover duration follows uniform distribution, U[2, 4]
- Once repairs are completed, the wells are reinstated and returned to production.
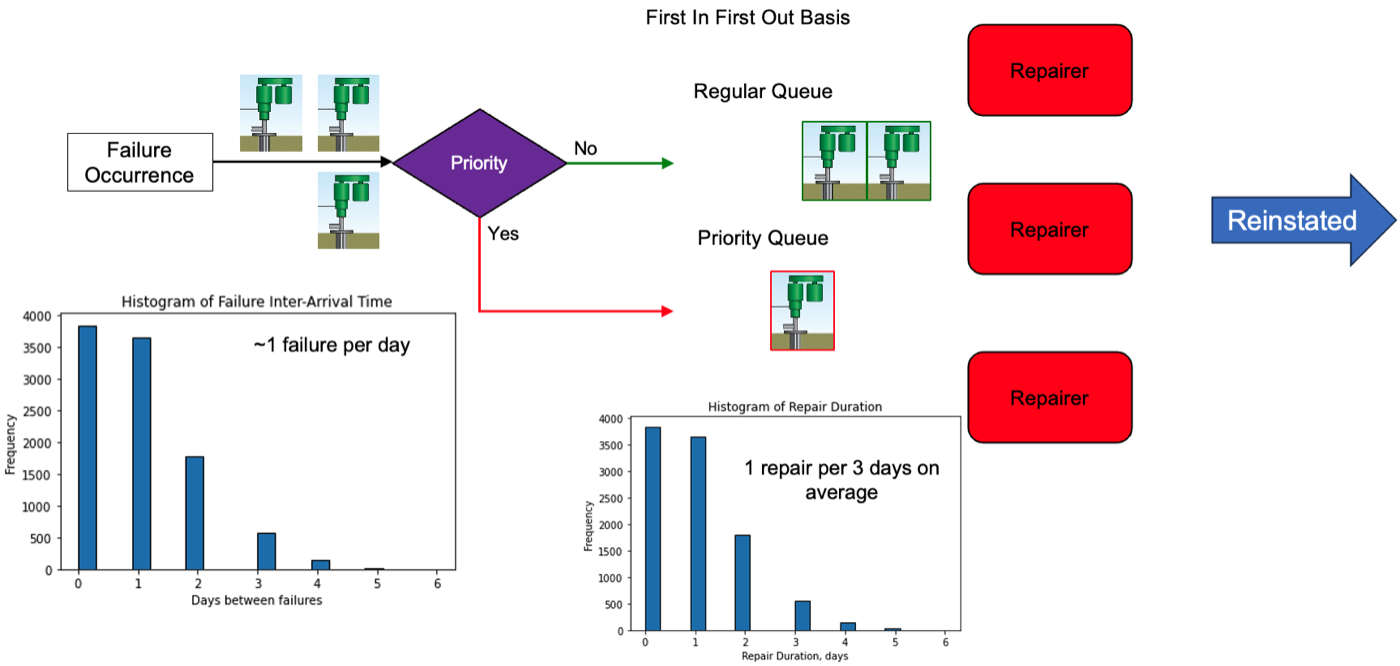
Workover Process
The simulation runs for 3,000 days, repeated 1,000 times to capture variability—just like weather forecasting, but for your operations backlog.
Want to do this for your own field? Stay tuned for Part 2, where I’ll walk through how to construct a random event generator from real operational data.
🔍 Key Insights from the Simulation
A few key takeaways from the results:
📌 Rig Utilisation: Your D&C team might love to see 100%, but be careful—it means there’s no slack in the system.
📌 Queue Lengths & MTTR:
- Priority wells get repaired in <4 days.
- Regular wells wait… ~40 days.
- This is queue-driven—not because repairs are slower, but because regular wells are always deprioritised.
📌 System Dynamics Over Time:
- In the second half of the simulation (Day 1500–3000), regular queues stabilise, suggesting 3 rigs are just enoughfor the load.
- Averages might lead you to the same conclusion (1 failure/day, 1 repair/day = balanced), but they ignore fluctuations and backlog growth in the early stages.
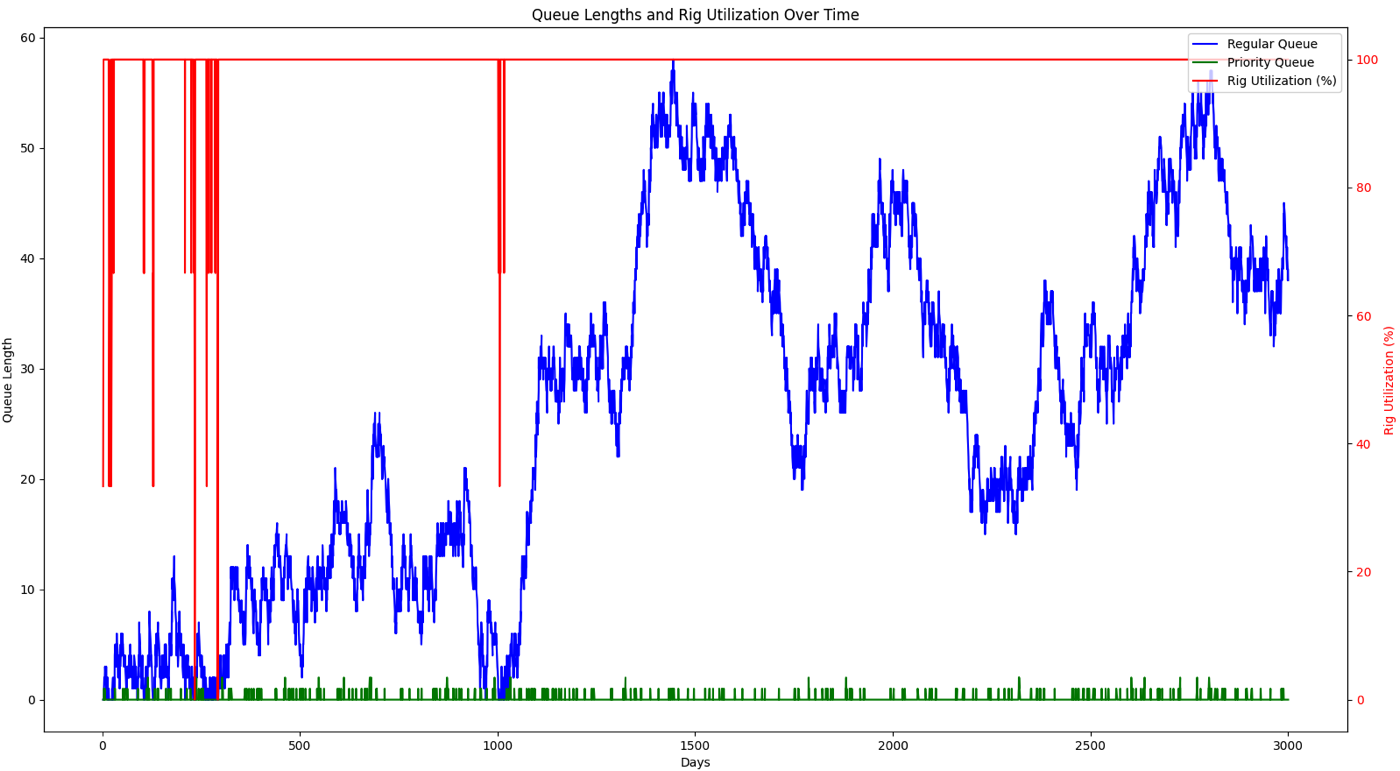
Rig Utilisation, Regular/Priority Queue Length
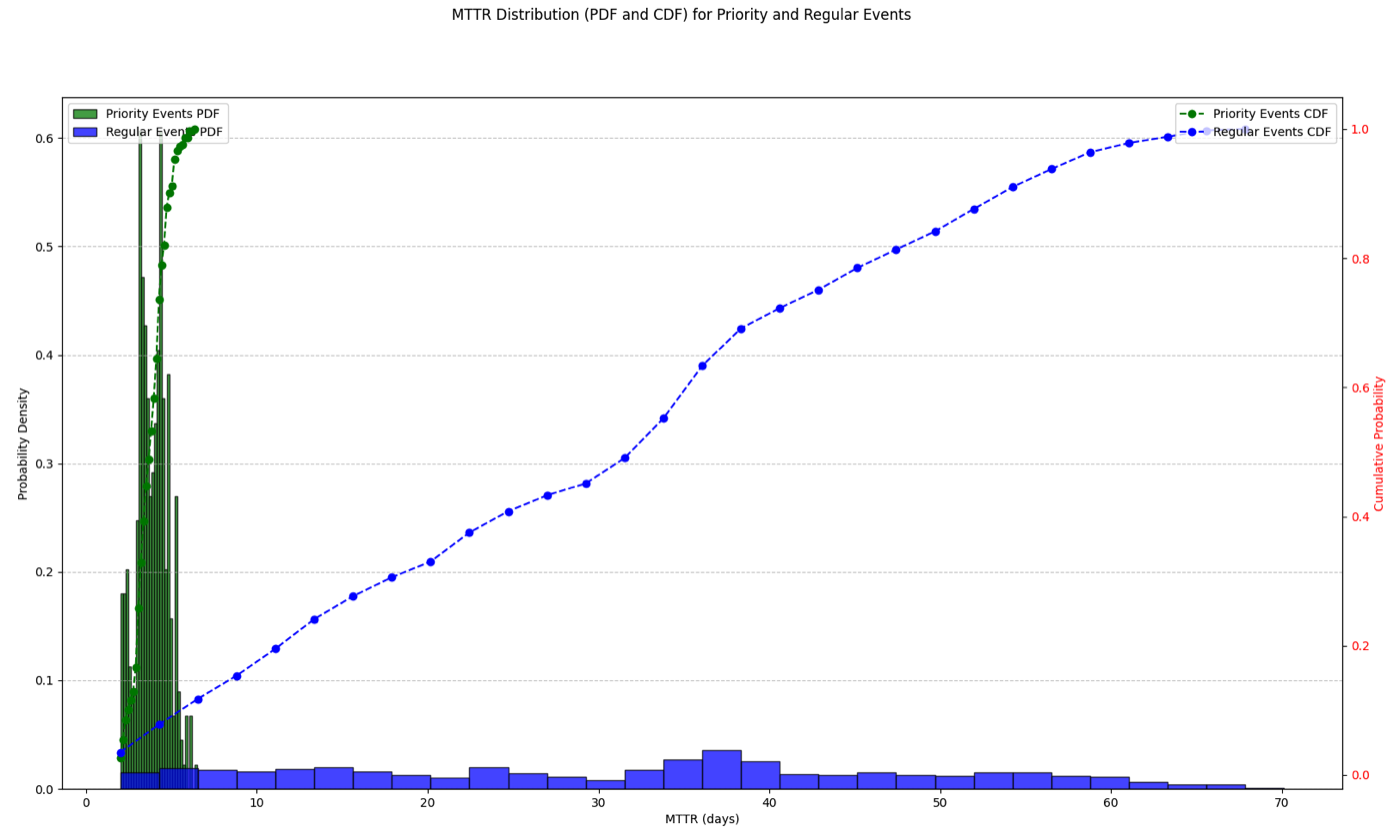
Regular/Priority Mean Time To Return (MTTR)
📊 What-If (Counterfactual) Analysis
This is where simulation shines: testing changes before making them in the field.
✅ Scenario 1: Add a 4th Rig
Backlog represents lost business value so there’s always a drive to reduce the backlog. In this example, assume you want to test a scenario with a 4th rig. You run the numbers and find:
- MTTR drops to ~3.3 days (priority) and ~4.5 days (regular).
- But… rig utilisation drops to 49%.
- When factoring in rig standby costs and lost production from failed wells (can be either assumed or extracted from actual data), the total cost is higher. Conclusion: Not worth it.
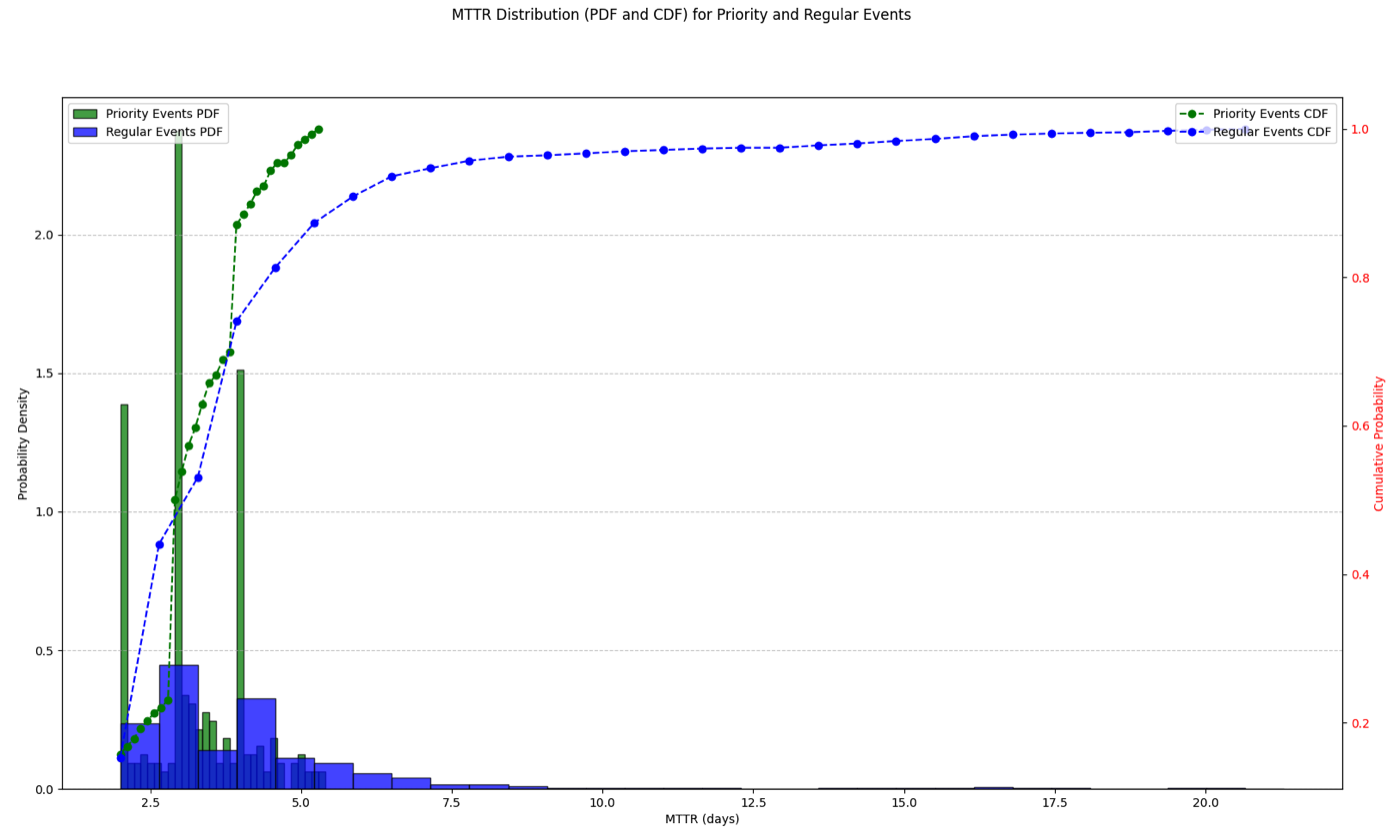
MTTR with 4 Rigs
🔺 Scenario 2: 30% More Wells (but no more rigs)
Failure rate increases to 1.3 per day.
Result? Backlog explodes, as rigs are constantly tied up with priority wells. Sound familiar? Many maintenance teams face this exact issue—priority jobs dominate, and the regular backlog never clears.
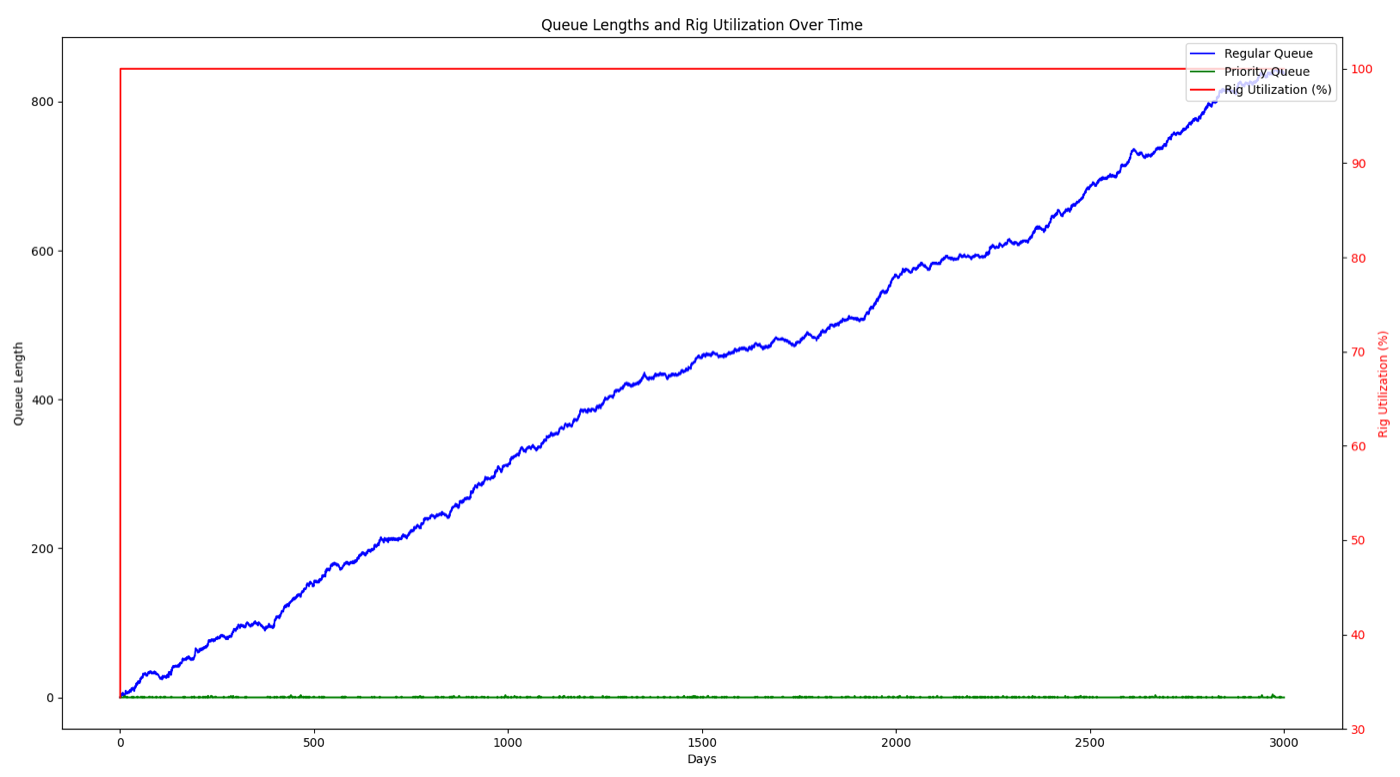
1.3 Failure Daily Rate and 3 Rigs
Increasing to 4 rigs, our operations is manageable again.
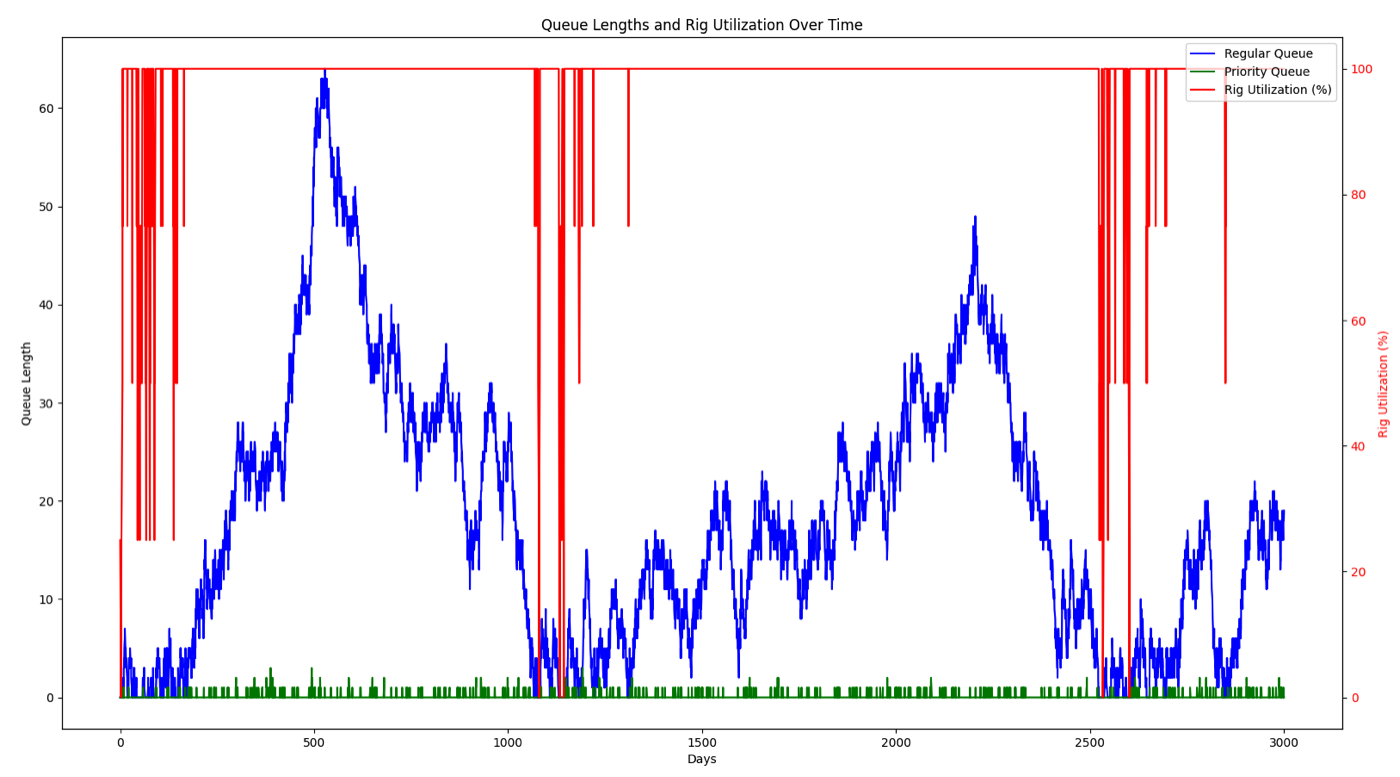
4 rigs and 1.3 failures per day
⚡ Scenario 3: Break-In Logic for High Producers
Instead of FIFO, you allow high-value wells to break into the schedule.
You can now test: What production rate justifies a break-in? And *how much faster do high-value wells return to service?*Just don’t forget the safety and operational constraints of break-in practice—this is where collaboration with field teams becomes critical.
🔄 Simulation Is Just the Start
This is only the beginning of process analysis—understanding your current state. What comes next depends on your business objectives: cost control, uptime improvement, prioritisation, or process redesign.
In Part 2, I’ll walk through how to:
- Use your actual logs and data,
- Build a model of your process,
- Measure performance with KPIs,
- And continuously improve via process mining and simulation.
🚀 Final Thoughts
Is your team making operations decisions using field data—or still going with gut feel?
Drop your thoughts below 👇
I’d love to hear your experiences with planning under uncertainty, backlog prioritisation, or process improvement.
#CSG #Workovers #OilAndGas #ProcessImprovement #Simulation #PetroleumEngineering #MaintenancePlanning #DigitalOperations #ProcessMining #LinkedInSeries