
Ever noticed how a coin flip can defy odds? 🤔 If you ask an engineer about the chance of a coin landing heads after five straight heads, they’d say “50/50,” assuming independence and fairness. But a 10-year-old might bet on heads again, showcasing the clash between theoretical probabilities and empirical evidence.
Switching gears to the high-stakes world of O&G, where the stakes are a tad higher than a coin flip. Let’s say the risk of something going awry in a well is pegged at 1 in 1000 per year. You’ve got 1000 wells and not a single hiccup in 10 years. Time to question that “1 in 1000” odds, right?
To untangle this, let’s dive back into our coin-flipping saga, but this time with a twist of statistical spice. Following a suggestion from my LinkedIn network, I shall also show Bayesian approach for completeness.
Frequentist Approach: Calculating P-Value
Define hypotheses
- Null Hypothesis (H0): The coin is fair, meaning the probability of heads (P(H)) = 0.5.
- Alternative Hypothesis (H1): The coin is not fair, meaning P(H) ≠ 0.5.
Calculate the probability of getting 5 heads in 5 flips with a fair coin is (1/2)^5 = 0.03125
Conclusion: the calculated probability is very low (<5% - typical p-value threshold), therefore we have some evidence that the coin is not fair
Bayesian Approach: Updating Beliefs with Evidence
- Constructing prior: this represents our prior belief of probability of heads prior to tossing the coin. As there was no information or assumption, the probability of heads is equally likely between 0 and 1, i.e. uniform distribution.
- Calculate the likelihood of observing 5 heads in 5 flips for each probability value of heads that was constructed in step 1
- Calculate posterior from likelihood (step 2) and prior (step 1)
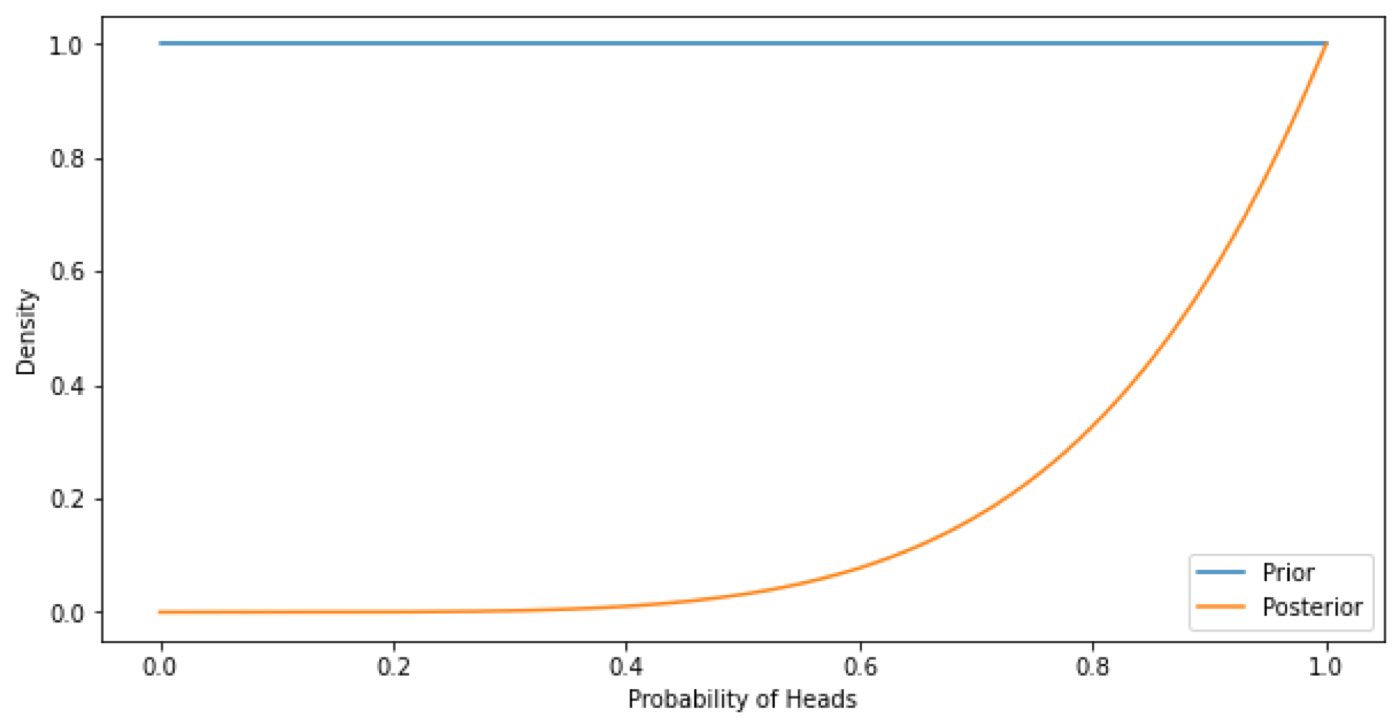
Prior and Posterior Distribution
The chart shows that the posterior probability of the coin landing heads is unlikely 50/50. In fact, with a mean of 0.858 from the data, it looks like there’s an 85.8% chance of getting heads on the next flip.
Back in the O&G universe, a p-value of 4.54×10^−5 for seeing zero events across 1000 wells over a decade makes our original “1 in 1000” look as likely as my chances of winning the lottery while getting struck by lightning. Maybe it’s time to rethink those odds, or at least, buy a more reliable coin.
#StatisticalAnalysis #Bayesian #Frequentist #DataDrivenDecision #RiskAssessment