From MTTF
Let’s start with the old faithful: Mean Time to Failure (MTTF). It’s quick, simple, and gives you a ballpark estimate of how long equipment will last. You calculate it by dividing total operating time by the number of failures within a specific observation window. Easy, right? Well, like all shortcuts, it comes with some serious limitations - especially when assessing shiny new technology.
Let’s break it down with a practical example:
You’re calculating MTTF for downhole pumps with a true MTTF of 50 months, using a 12-month rolling observation window. To see how sample size impacts results, we analyse scenarios with 20, 50, 100, and 1000 units over a 10-year period.
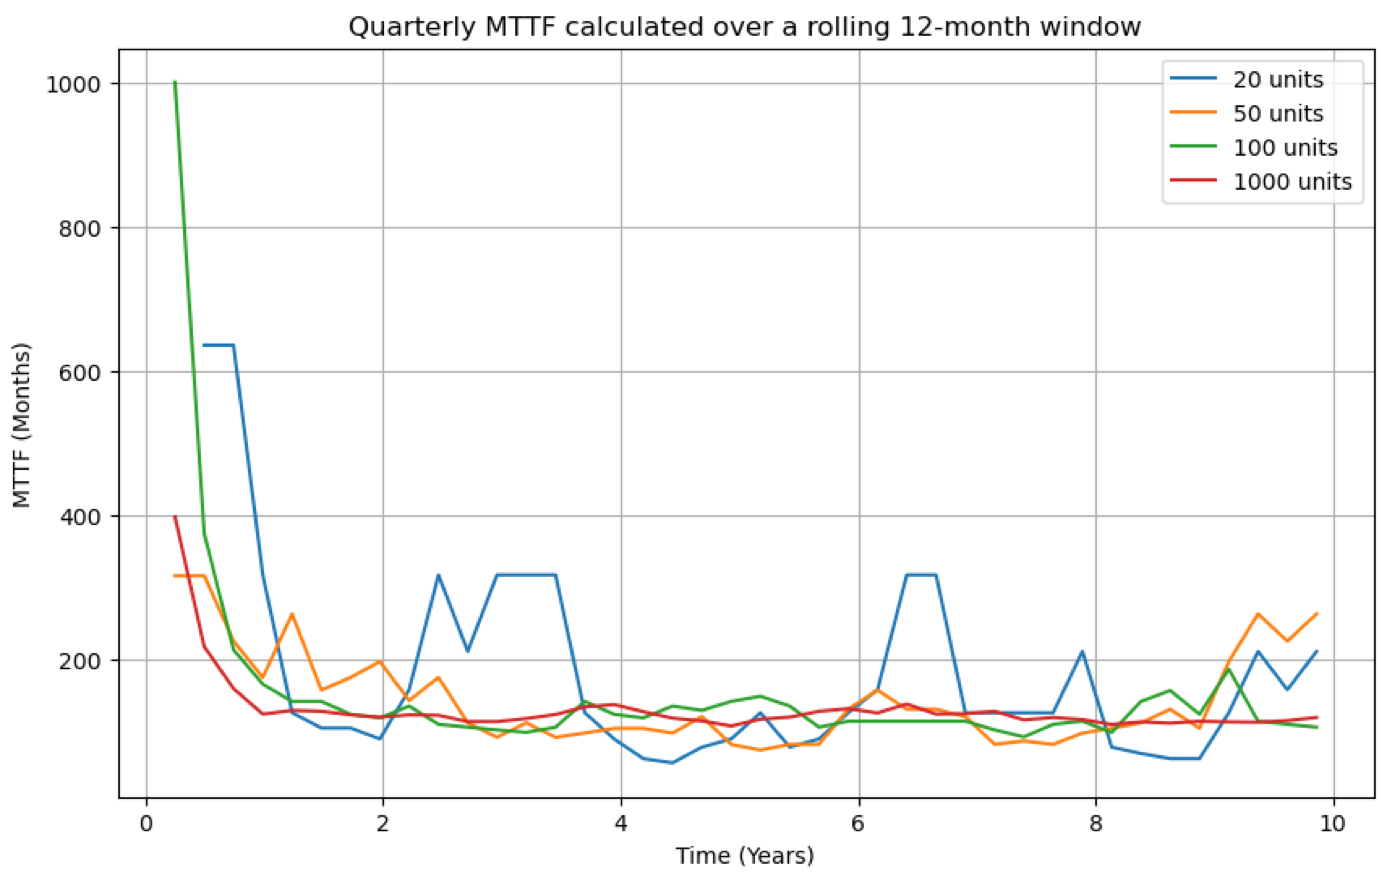
Calculated MTTF with sample size and system burn-in
What did we learn from the simulated results? 📊
- Optimism overload: The initial MTTF estimates are way too rosy. It took around 2 years for failures and replacements to randomise and settle into something realistic. This phase is affectionately called the system burn-in period - like your toaster figuring out how not to burn your toast.
- Size matters: Larger sample sizes produce more stable MTTF values and are less sensitive to random failure spikes.
MTTF becomes problematic when applied to new technology assessment. For example, if you’re trialling a solid mitigation solution designed to extend MTTF for PCP systems:
- Non-randomised installations and small sample sizes skew results.
- Observations conducted during the burn-in phase (6–12 months) fail to capture long-term performance.
Relying solely on MTTF in such cases? It’s like trying to judge a marathon by only watching the first mile. Misleading at best.
To Survival Analysis
Survival analysis, originally a superstar in health sciences, is making waves in reliability engineering. Its specialty? Analysing time-to-event data, like the time until your equipment decides to give up.
Here’s why survival analysis outshines MTTF:
- All data is welcome: It uses everything, from day one to the analysis date. No cherry-picking small observation windows here and no system burn-in.
- Handles censored data like a pro: Got equipment that hasn’t failed yet? No problem—it factors those in too.
- Deeper insights unlocked: With advanced regression modelling, you can explore how factors like operating conditions, installation methods, or maintenance schedules influence failure times. Think Sherlock Holmes for reliability.
Let’s revisit our earlier scenario with different sample sizes and generate survival curves (see graph below).
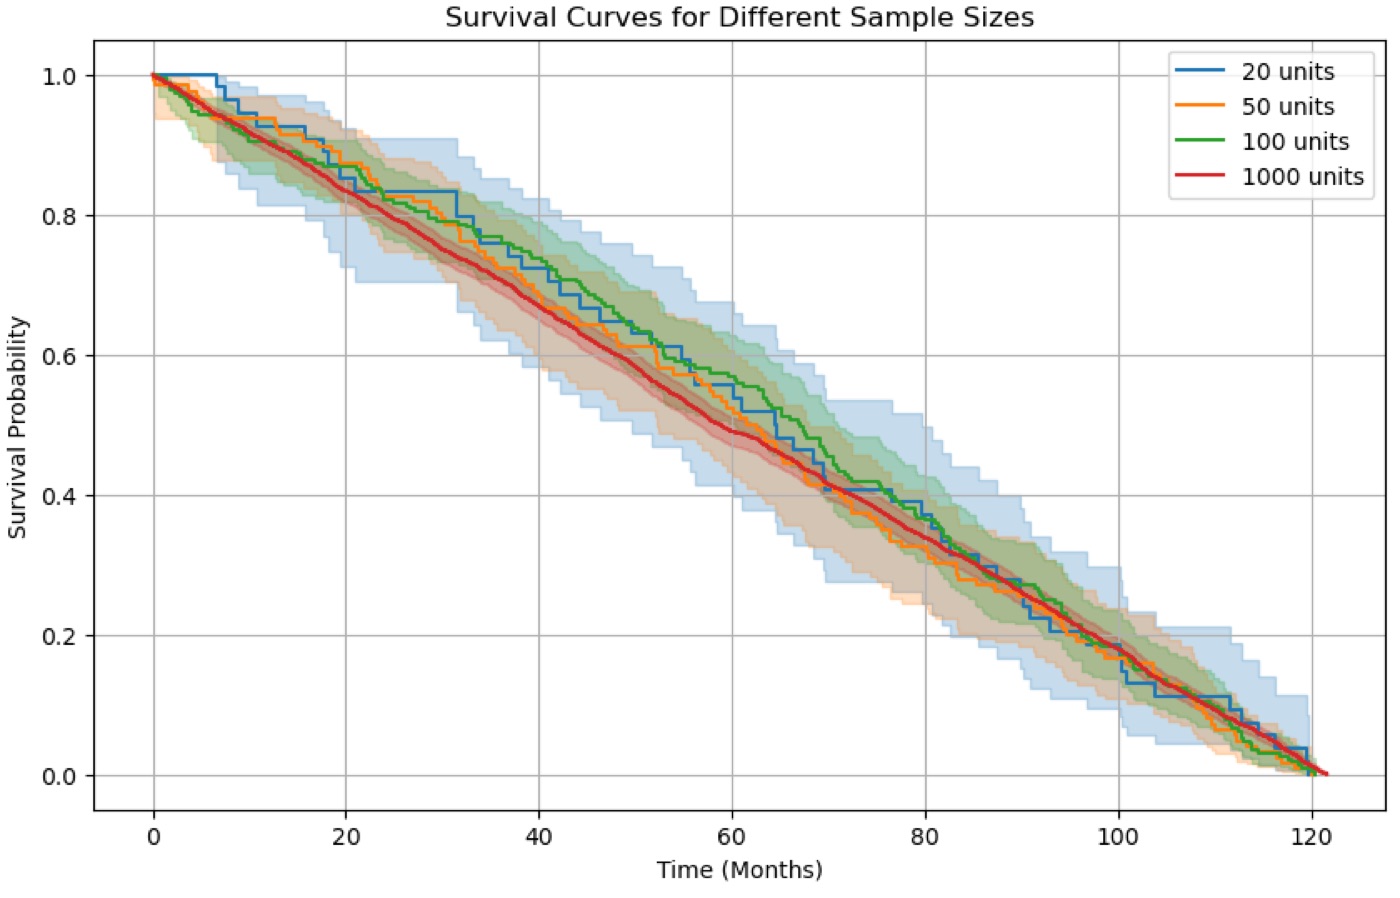
Survival Curves
Here’s the cheat sheet for reading them:
- At 20 months, over 80% of the units are still operational.
- Those shaded areas? That’s the 90% confidence interval. Notice how it shrinks with larger sample sizes? Bigger groups = smaller uncertainty.
- Want to compare two groups, like “before” and “after” introducing solid mitigation technology? Plot survival curves for both and use either a visual comparison or a more robust log-rank test to see if one group’s MTTF is statistically different.
Still love MTTF? (No judgment—it’s nostalgic.) You can derive MTTF from the survival curve. How?
- MTTF = Area under the survival curve. No complex math here - just trust the process.
And MTTF is Mean TTF, the other Median TTF (maybe mTTF??) is the value at 0.5 survival probability. Just a little tip.
Why Survival Analysis?
Because it’s not just about averages; it’s about actionable insights. Whether you’re a fan of MTTF or swear by survival curves, this approach helps you make smarter, data-driven decisions.
So, what’s your take? Are you ready to ditch outdated methods and embrace smarter reliability tools?
#SurvivalAnalysis #MTTF #Reliability #TechnologyTrial