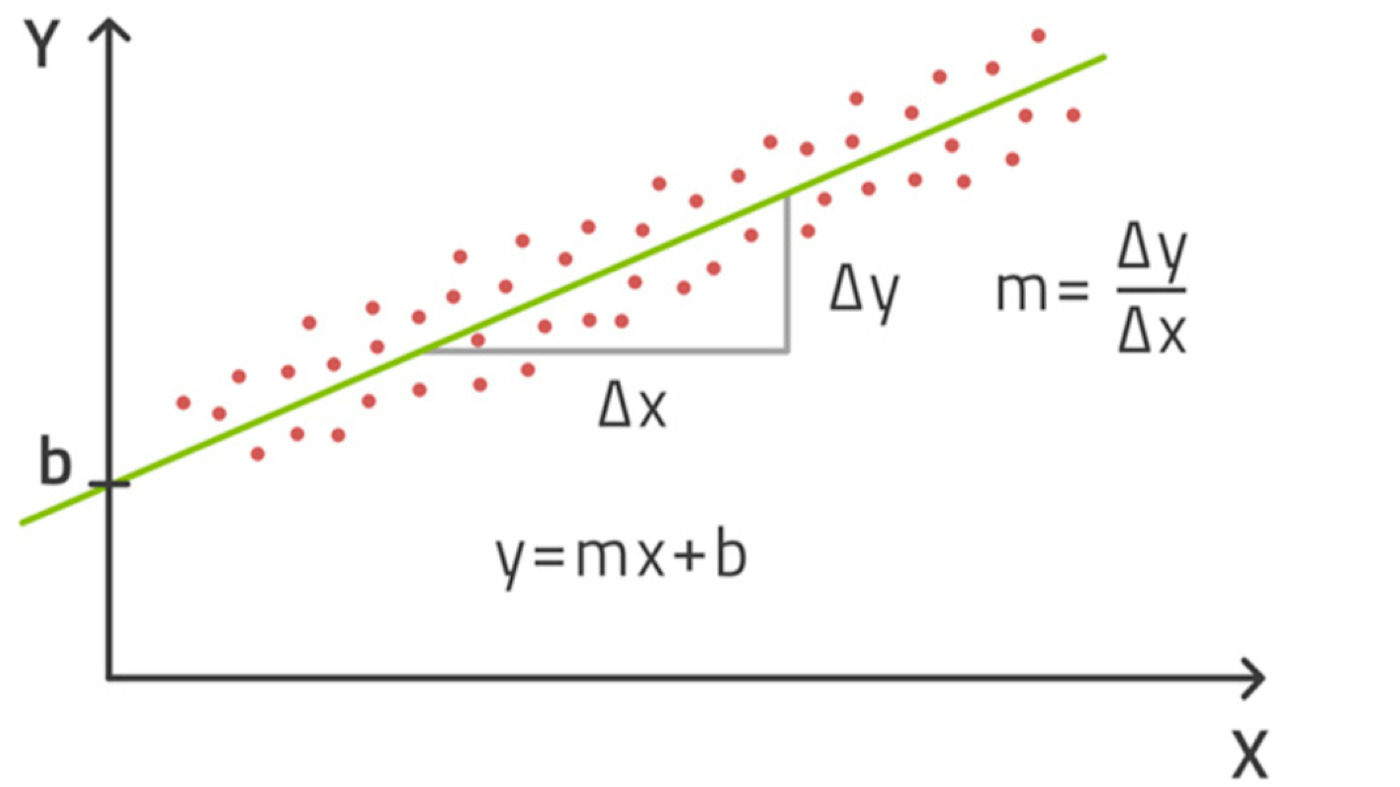
I’ve been wondering, why do we engineers love fitting a straight line so much?
Remember the semi-log or log-log plots? We’d bend, twist, and transform our data just to see that beautiful line. And honestly, I still find it satisfying, something about how clean and elegant it looks to the eye.
But here’s the thing…
In oil and gas, we often stop at “it looks good” or “R² > 0.7.”
In machine learning, that’s just the beginning.
Fitting a straight line is formally known as linear regression, and while it’s familiar, ML treats it with more scrutiny. Behind the simplicity lies a set of statistical assumptions that must hold for the model’s outputs to be valid and trusted.
A simple linear regression model typically takes the form:
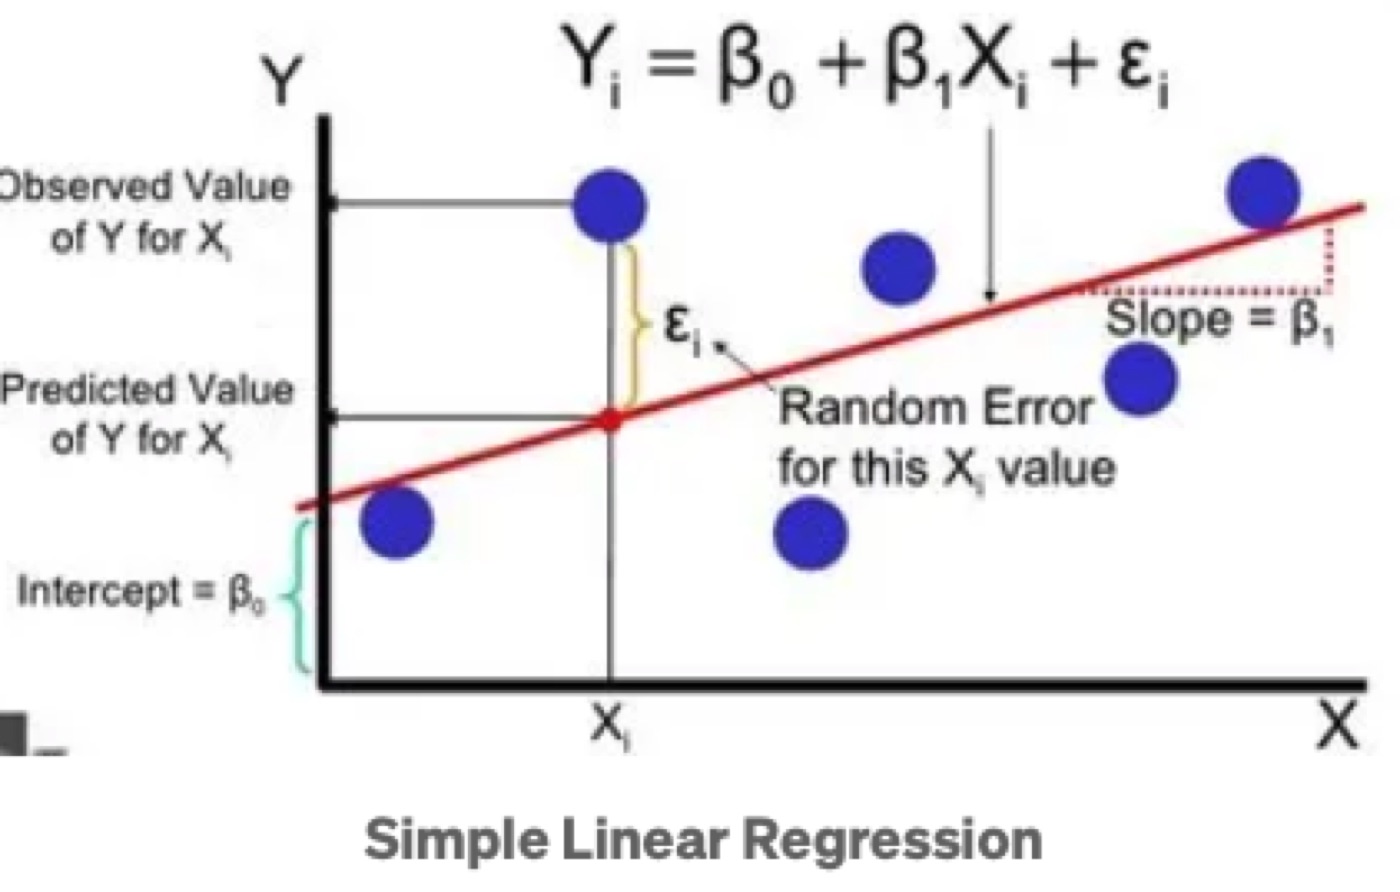
SImple Linear Regression
Although in O&G, we did not typically think much about “fitting a straight line” as long as it looks good and that R2 is somewhere more than 0.7-0.8. In ML, the validity of this model hinges on several critical assumptions. If they’re violated, the estimated coefficients may be biased, inefficient, or misleading. So let’s see what we can learn from that.
Note: in simple linear regression with a single predictor (X), some below assumptions were not applicable.
📌 Assumption 1: Linearity
The relationship between the independent variables and the dependent variable is linear.
❓ Why it matters:
If the relationship isn’t linear, you’re misrepresenting reality, which means bad predictions.
✅ How to check:
- Plot residuals vs. fitted values: should look like random scatter.
- Partial residual plots: to isolate individual variable effects.
🔧 Remedy:
Engineers do this all the time! Apply log, square root, or polynomial transformations.
📌 Assumption 2: Independence of Errors
The residuals (errors) should be independent of each other.
❓ Why it matters:
Autocorrelated residuals (especially in time series data) can lead to underestimated standard errors and overly optimistic p-values.
✅ How to check:
- Durbin-Watson test: Detects autocorrelation (values near 2 indicate no autocorrelation).
- Plot residuals vs. time/order: Patterns (like waves or trends) suggest autocorrelation.
🔧 Remedy:
Use time series models (e.g., ARIMA)
📌 Assumption 3: Homoscedasticity (Constant Variance of Errors) - What a term! I can’t pronounce it
The variance of the residuals is the same across all levels of the independent variables.
❓ Why it matters:
If heteroscedasticity exists (i.e., non-constant variance), standard errors of coefficients become biased, affecting confidence intervals and hypothesis tests.
✅ How to check:
- Residuals vs. fitted values plot: Look for a funnel shape, widening or narrowing spread indicates heteroscedasticity.
- Breusch-Pagan test: A formal statistical test.
- White test: Another robust option for detecting heteroscedasticity.
🔧 Remedy:
Transform response, weighted regression
📌 Assumption 4: Normality of Errors
The residuals should be normally distributed (especially for inference, like p-values and confidence intervals).
❓ Why it matters:
Normality is not required for point estimates, but it’s crucial for valid hypothesis testing and confidence intervals.
✅ How to check:
- Q-Q Plot: Residuals should lie approximately on a 45° line.
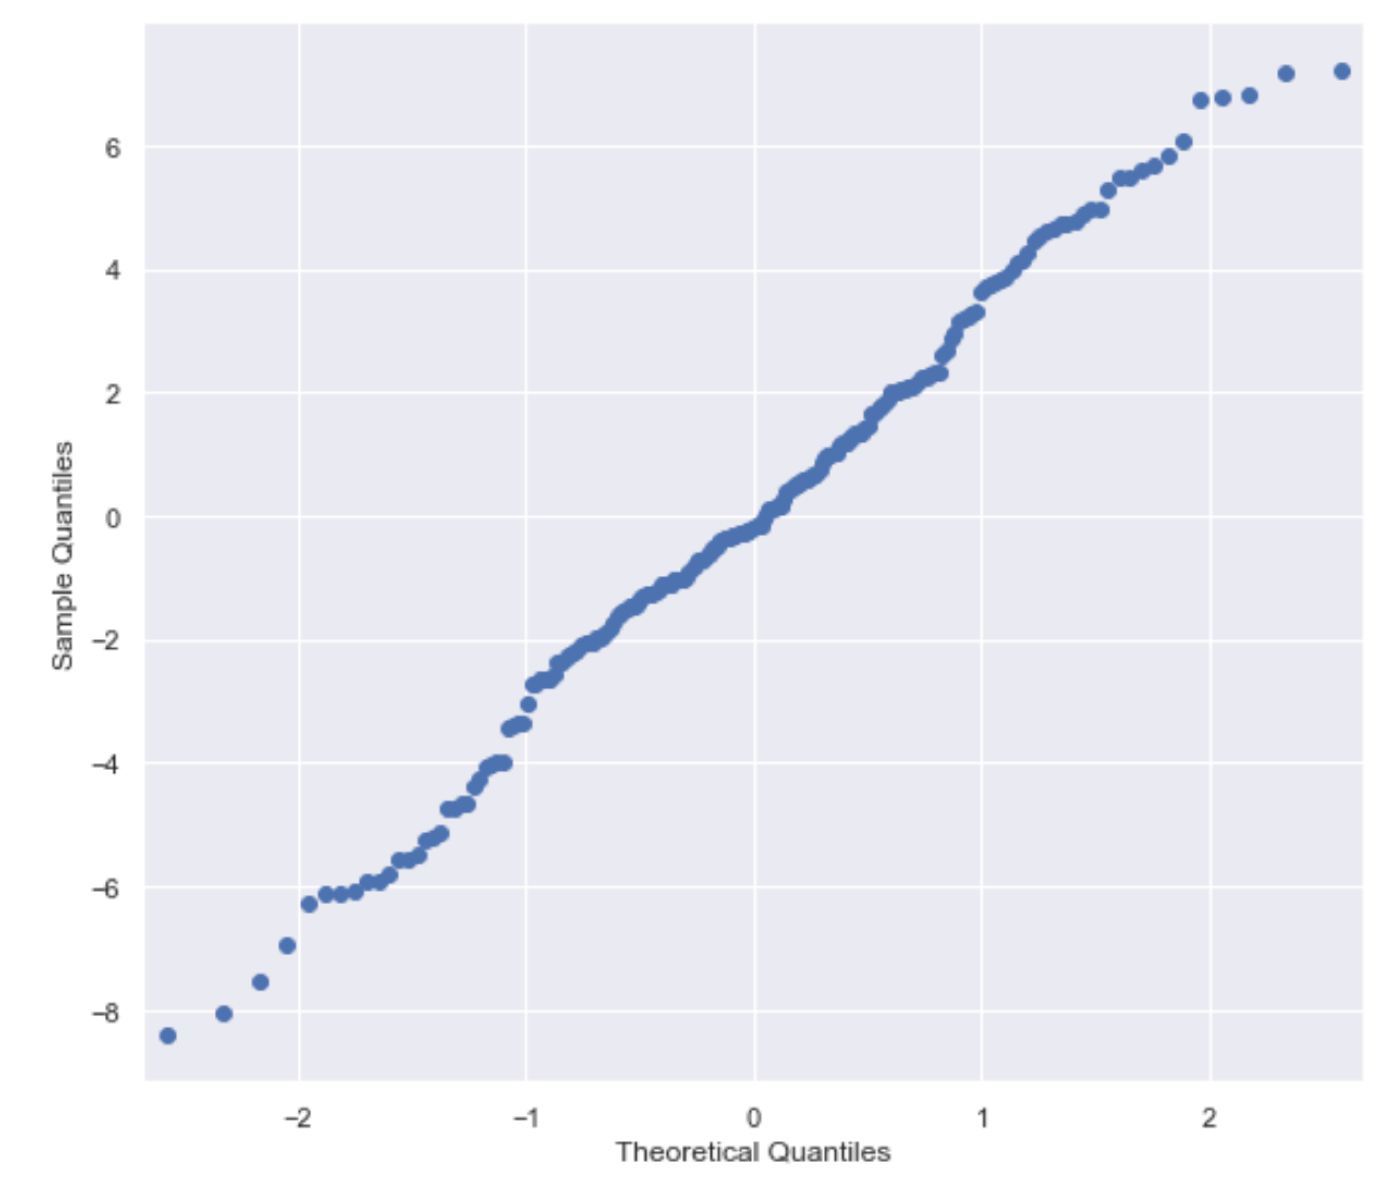
- Histogram of residuals: Should resemble a bell curve.
- Shapiro-Wilk or Anderson-Darling tests: Formal normality tests (note: sensitive to sample size).
🔧 Remedy:
Use robust regression or bootstrapping
📌 Assumption 5: No Multicollinearity
Independent variables should not be highly correlated with each other.
❓ Why it matters:
Multicollinearity inflates the variances of the coefficient estimates, making it hard to determine the effect of individual predictors.
✅ How to check:
- Variance Inflation Factor (VIF): A VIF > 5 (sometimes 10) indicates problematic multicollinearity.
- Correlation matrix: Check for high pairwise correlations between features.
- Condition index: Part of the collinearity diagnostics.
🔧 Remedy:
Remove/reduce features, Principal Component Analysis
🧠 Insight: Use GLMs or Robust Methods When Assumptions Break
If your data violates normality or homoscedasticity, Generalised Linear Models (GLMs) can be a better fit:
- Logistic regression for binary outcomes
- Poisson regression for count data
- Use robust standard errors or bootstrapped confidence intervals if normality/homoscedasticity is weak
🛠️ Real-World Use Cases of Linear Regression in Oil & Gas
💡 Production Forecasting:
Used to predict production rates from time-series data, especially in unconventional wells. Regression models are often benchmarked against Arps decline curves and can outperform them in certain cases .
💡 Gas Lift Rate Prediction:
ML models, including MLP regression and linear regression, have been used to predict oil, water, and gas rates based on surface and downhole parameters like BHP, WHP, choke size, and gas injection rates .
💡 Petrophysical Property Estimation:
Multiple linear regression is used to estimate log-derived properties like permeability or saturation from other well log inputs .
💡 Well Performance Classification & Planning:
In field development, linear regression is used after PCA to rank and classify well performance, helping to place new wells optimally based on analogues .
🎯 Final Thoughts for Engineers
Fitting a straight line may look simple, but doing it right takes rigour.
As engineers, we often lean on physical intuition and well-established equations. Many of the relationships we use daily were derived from first principles. But even physics-based models come with assumptions, simplifications, and hidden variables we may not fully account for.
In data-driven modelling, we face the same challenge:
Assumptions matter, and trust must be earned, not assumed.
So the next time you draw a trendline in Excel, run a regression in Python, or build a dashboard in Power BI, pause and ask yourself:
“Have I earned the right to trust this model?”
Let’s carry the same engineering discipline we apply to pipelines, wells, and reservoirs, into our data science workflows. 👷♂️📊
👋 I’d love to hear from others applying regression in real-world O&G settings. What’s worked (or not) for you?
#MachineLearning #OilAndGas #DataScience #LinearRegression #GLM #EngineeringAnalytics #ProductionEngineering #ReservoirEngineering