📊 Graphs, Gaffes, and Giggles: The Wild World of Visualisation
Alright, folks, here’s the skinny! Got a pulse? Know your way around a spreadsheet or had a casual fling with Power BI or Tableau? Congrats, you can probably rustle up a graph! But here’s the kicker: just because you can, doesn’t mean you should.
Picture this: using a chainsaw to butter toast. Overkill? Yep. Same goes for using heavyweight visualisation tools for simple jobs. Know your why before you fly! What’s the story? Is this the right stage for a visual? You wouldn’t use a sledgehammer to crack a walnut… or would you? 🤔
Now, I’ve heard the whispers. “I can look at a graph and see the Matrix!” Mmm, cool story, Neo. But while visuals might give you that cool wind-in-the-hair feeling as you surf data waves, they’re more like the bookends of data analytics: great to kick things off (exploration) and wrap things up (presentation). But the meaty interrogation? That’s a whole different ball game.
Pitfall Parade: The ‘Oops’ of Visualisation
- Over-Simplicity: Think of a kid summarising a movie. You get the gist, but details? Not so much.
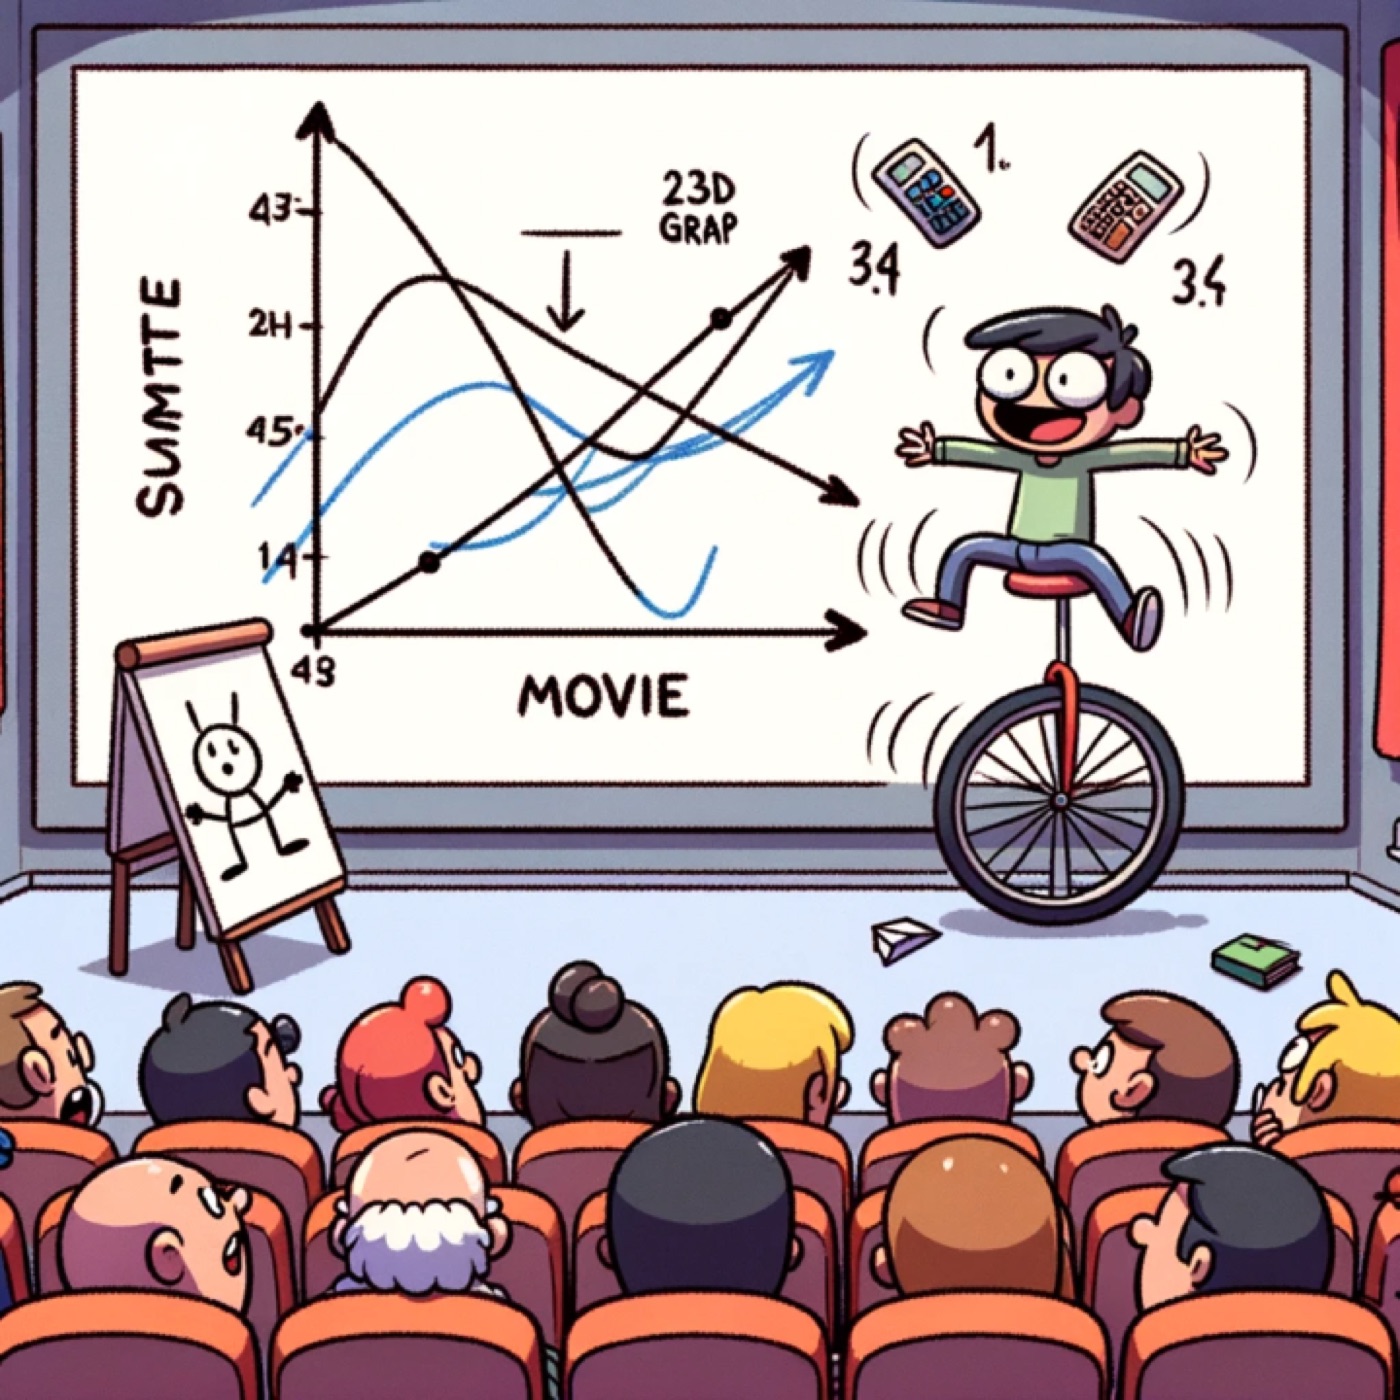
- Dimensional Dilemmas: A typical 2D graph shines when showcasing bivariate relationships. But toss in a third or fourth variable? It’s like juggling while riding a unicycle. Possible? Yes. Easy to interpret? Not always. And often, important multivariate interactions get lost in the shuffle.
- Too Much Jazz: Ever seen a graph that looks like it partied too hard at a data carnival? Less confetti, more clarity!
- Misleading Angles: Slight tweaks can turn flat terrains into Himalayan peaks. Watch those scales!
- Confirmation Bias: Sometimes, there’s a temptation to design visualisations that confirm pre-existing beliefs. This can lead to selectively showcasing data or designing charts that give a skewed perspective.
- Lost in Translation: Not everyone speaks “Advanced Chart-ese.” Know your audience!
In summary: Visuals are the snazzy jackets of the data world: they make things look good, but you still need the proper tools underneath to get the real work done. Dive deep, use wisely, and remember: it’s not the size of the tool, but how you use it in the data journey! 😉